An exchange handles your buys and sells. It doesn’t tell you when your allocation has drifted, what a chart pattern actually means, or that a Fed rate decision lands in six hours. That’s what the tools below are for — three categories, and where each earns its place.
Portfolio Trackers: Seeing Your Actual Diversification
Once you’re holding crypto assets across more than one exchange or wallet, a tracker is the only realistic way to see your total exposure in one place instead of guessing.
- CoinStats covers the widest ground — CeFi and DeFi wallets, NFTs, and built-in security scanning alongside portfolio analytics, with the option to buy, swap, and earn yield directly from the same dashboard.
- Delta is built for a mixed portfolio — if you also hold stocks alongside crypto, it’s one of the few trackers that unifies both views instead of forcing you between separate apps.
- Koinly leans into tax and reporting, syncing with over 700 exchanges and wallets — worth a look given the BIR tax questions we flagged in our beginner’s guide.
Why this matters for diversification specifically: the risk and money management rules we’ve covered — position sizing and overall allocation — only work if you actually know your current numbers. A tracker is what turns “I think I’m around 5% in crypto” into an actual figure.
Charting Platforms: Where Technical Analysis Happens
TradingView is the default charting tool most traders end up on, crypto or otherwise, and it’s worth learning even if you never place a trade directly from it:
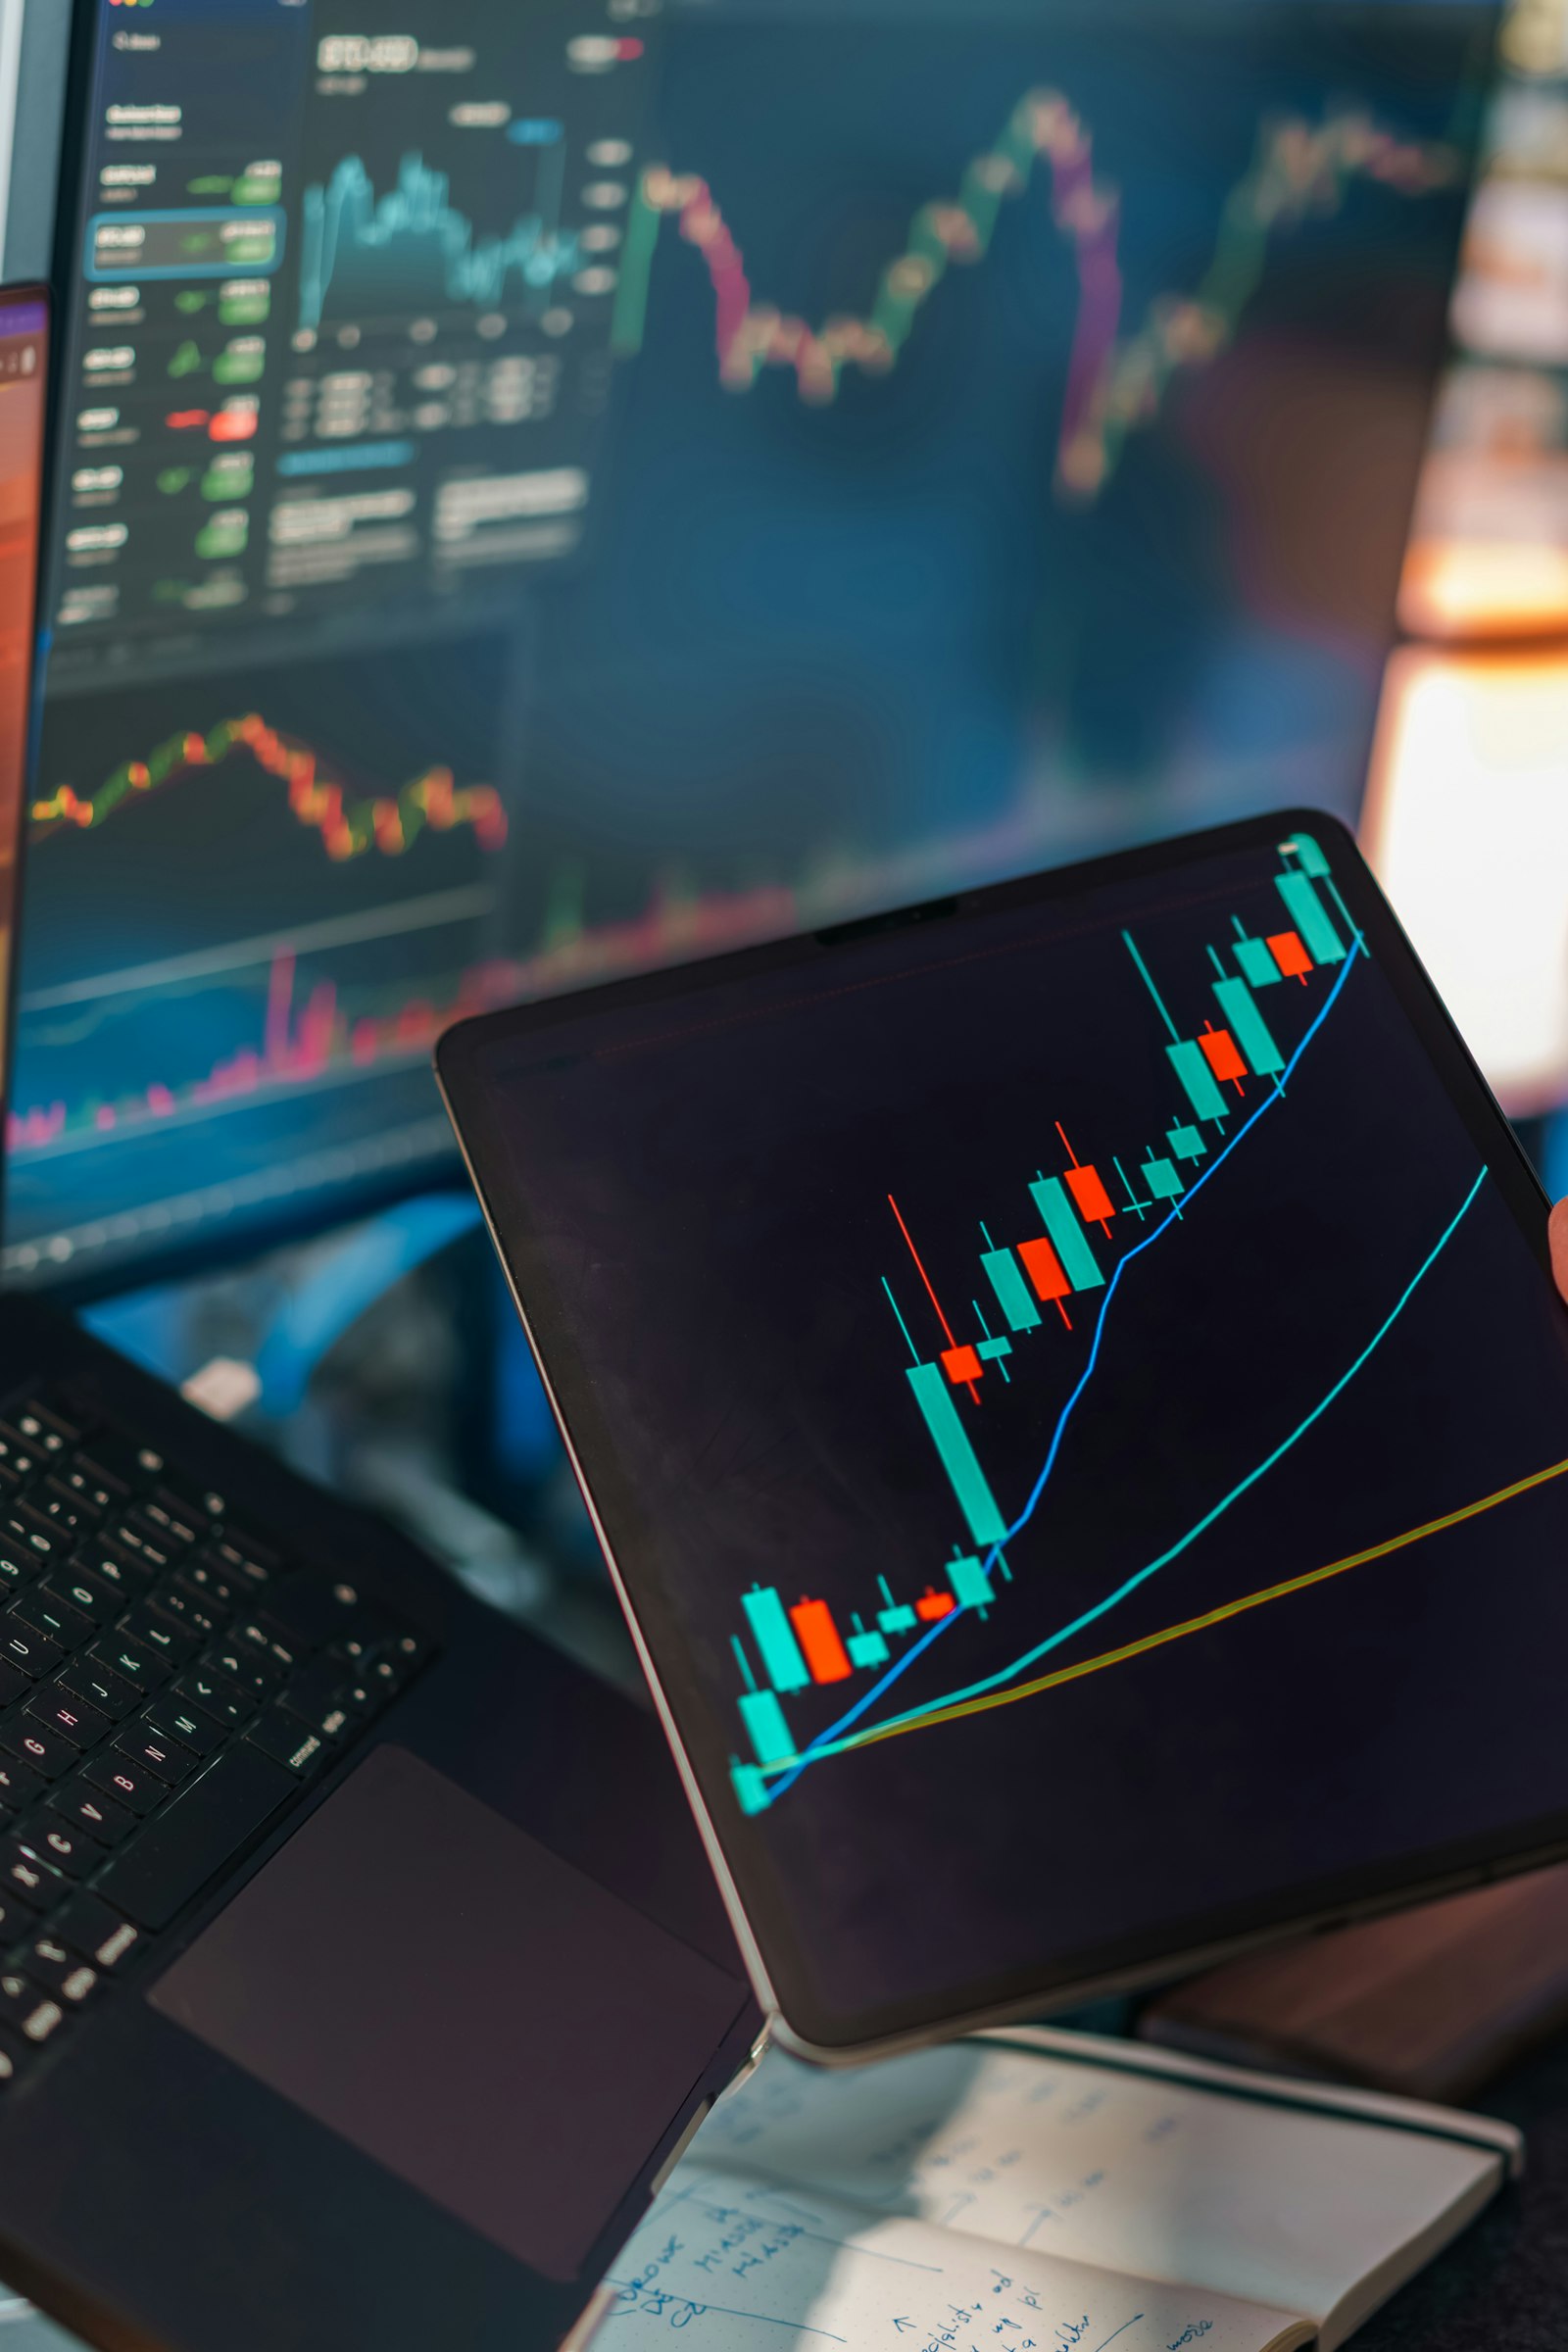
- Candlestick charts are the standard way price is displayed — each candle shows the open, high, low, and close for a period, and reading them is the first real skill in technical analysis.
- Trend lines, drawn by hand across a series of highs or lows, are the simplest way to visualize the direction the market is actually moving in, as opposed to what a single day’s price move might suggest.
- Support and resistance levels mark prices where an asset has repeatedly stopped falling or rising — useful reference points for the stop-loss placement we covered in our risk management guide.
- Fibonacci retracement is a drawing tool based on a specific number sequence, used to mark likely support/resistance levels during a pullback from a prior move — one of the more commonly used, and more commonly misused, tools in retail technical analysis.
None of these tools predict the future — they’re ways of organizing what price has already done, which is a meaningfully different (and more honest) claim than what a lot of “signals” marketing implies.
Economic Calendars: Knowing What’s Coming
Crypto doesn’t move in a vacuum — interest rate decisions, inflation data, and other macro releases move markets broadly, crypto included, which is exactly the kind of context we flagged affecting prices in our weekly PH crypto digest.
- Forex Factory is widely used specifically because it posts actual data the moment it’s released, with an active trader community discussing how each release is likely to move markets.
- Investing.com covers indicators from over 40 countries and has a large mobile user base, with fast push notifications on both iOS and Android.
- TradingView also embeds economic events directly onto price charts, letting you visually line up a past release with how price actually reacted at the time.
Most retail traders don’t need more than one calendar and one charting tool — the value is in checking them consistently, not in collecting more dashboards.
Which Combination Actually Makes Sense
- New to technical analysis: start with TradingView’s free tier for charting, and one portfolio tracker once you’re on more than one platform.
- Trading around news and macro events: add an economic calendar (Forex Factory or Investing.com) to your routine, checked as part of the daily/weekly habit we recommended in our risk management guide.
- Filing taxes or tracking many wallets: Koinly or a similarly reporting-focused tracker earns its place specifically for that job, separate from day-to-day charting.
Video: Reading Fibonacci Levels on a Real Chart
This is a third-party video, not produced by Crypto Observe.
Frequently Asked Questions
Do I need a portfolio tracker if I only use one exchange?
Less urgently, but it’s still useful — most trackers also show performance metrics (like actual return over time) that exchange apps don’t calculate for you directly, on top of the diversification view that matters more once you’re spread across platforms.
Is TradingView free to use?
Yes, TradingView has a functional free tier covering charting, candlesticks, trend lines, and Fibonacci tools — enough for most retail traders. Paid tiers add more indicators per chart and faster data refresh, which matters more for very active day traders than for someone checking charts a few times a day.
What’s the difference between support/resistance and Fibonacci levels?
Support and resistance are based on actual past price behavior — levels where the market has previously reversed. Fibonacci retracement levels are calculated from a mathematical ratio applied to a recent price move, used as a hypothesis for where a pullback might stall, not a guarantee based on history at that exact level.
Which economic calendar events actually move crypto prices?
U.S. Federal Reserve interest rate decisions and inflation data (CPI) tend to have the most visible impact on crypto broadly, since they affect risk appetite across all volatile assets, not just equities — the same dynamic we saw affecting bitcoin and ethereum prices in our weekly digest.